
| JEM-X1 | JEM-X2 |
|
|
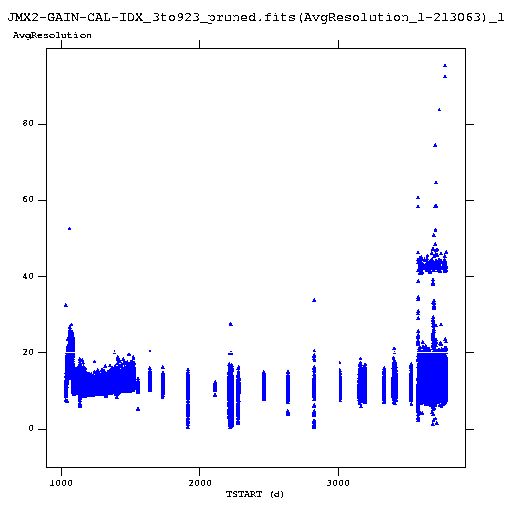
These figures show the percent energy resolution of the peaks fitted to the raw calibration spectra. Each figure shows the averages for the four calibration sources in the relevant unit. Initially, the two units showed a steady, though modest worsening of resolution as their microstrip plates age, but fairly soon other effects both increase the width of the spectra and the scatter on the data: observations of very strong galactic sources that scatter stray photons into the calibration areas, the death of anode strips that pass through the calibration areas and localized changes in the spatial gain of the plates. Individually, each the 8 spectra show separate and varied histories of these effects.
The general worsening of the instrumental energy resolution as the instruments age and their spatial gain variation evolves was for the first half of the mission successfully countered by the use of updated spatial gain variation tables. However later attempts to create new SPAG tables to improve instrumental resolution have failed, suggesting that this is no longer the only source of degraded energy resolution
Finally, the decay in intensity of the calibration sources leads to a huge scatter in the fitted line widths that makes it impossible to discern any slight increase due to aging of the microstrip plate. For example, the sudden huge increase in line widths at the end of the figure for JEM-X1 is due entirely to a dead anode developing under source 4. A similar though smaller jump in line width was seen considerably earlier in source 2.
| JEM-X1 | JEM-X2 |
 |
 |
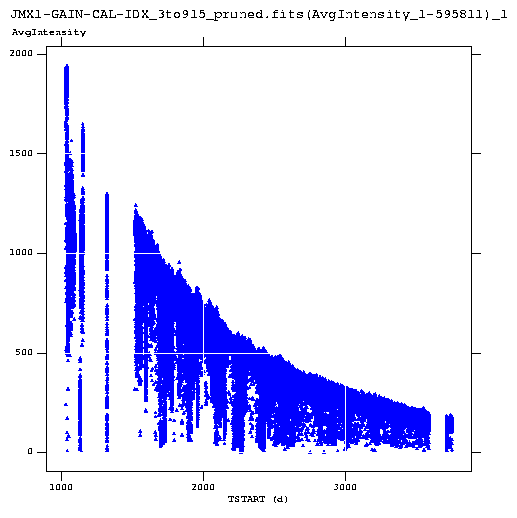
The average intensity for each unit largely followed the expected decay law for the radioactive cadmium and iron calibration sources. However, individually, most calibration sources show one sudden decrease or increase in intensity, probably related to the radiation damage sustained by the source housing. The most notable of these is a more than 100% increase in intensity on JEM-X1 source 4 between IDJ=2000 and 3000. The scatter of data points below the maximum intensity level is due to the grey filtering that is introduced on all data during observation of strong X-ray sources. This is why energy correction for very strong sources (Crab and SCO X-1) often requires offline correction since the available calibration data is so weak. Approaching IJD=4000 all calibration sources are substantially weaker than at the beginning of the mission and any grey filtering can cause automatic gain correction to fail. In these cases DNSC provides offline calibration tables to ISDC and these MUST be used to get good energy correction for the science data. The OSA software is being updated to handle the calibration data in a more robust and conservative manner (i.e. assuming that it's always too weak) so that these instances can be avoided as much as possible.
| JEM-X1 | JEM-X2 |
 |
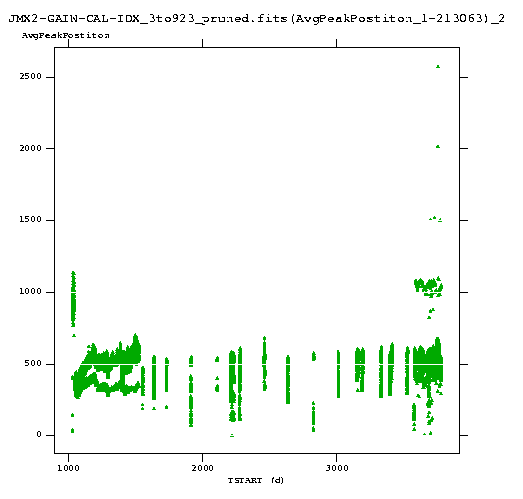 |
The position of the calibration peak gives us the gain of the microstrip plate AT THAT POINT ON THE MICROSTRIP PLATE, and from all four sources in a unit we can calculate the gain of the instrument and correct for each area of the plate using Spatial Gain calibration tables (SPAG tables) which are part of the instrument IMO used by OSA. Each source has its own reference channel position, also in the IMO, which describes how the postion of the calibration source peak at a given temperature relates to the average instrument gain. These reference channels have evolved during the mission as the microstrip plate has aged and dead anodes have appeared in the calibration areas. Unfortunately, the calibration areas irradiated by the calibration sources aged more rapidly than the rest of the plate due to the hight radiation levels and initially in the mission the reference channels had to be updated quite frequently.
Generally, the position of the calibration peaks and gain of the instrument depend linearly on the temperature of the instrument. However, more complicated, non-linear effects contribute to a large degree:
Warm UpImmediately after switch-on, after perigee and exit from the radiation belts, the microstrip plate and instrument warms up very much compared to temperature variations that may occur during the revolution. This is an especially strong effect when the unit has been dormant for many revolutions and during the eclipse season when the the satellite passes through the Earth's shadow at perigee and cools to much lower temperatures than usual. In these cases, non-linearities in the gain/temperature dependence become important at the 2-3% level. However, other larger effects of instrument switch-on make the early science windows in each revolution less accurate in their energy determination than Science Windows later in the revolution.
Microstrip plate charging As the instrument warms up charges on the surface of the plate (fast gain change) and ions within the glass itself (slow gain change) build up and re-arrange themselves so that the overall gain and spatial gain variation change quite rapidly in a way that cannot be tracked by the four calibration sources, which see only the changes in their own patches of the microstrip plate, which do not reflect the changes in the other parts of the plate. The fast gain change dominated at switch on at the beginning of the mission and is due to surface electrons reaching equilibrium densities across the plate. Therefore in the beginning of the mission gain started high at switch-on and rapidly dropped. For this reason initial switch-on value of the High Voltage supply was one step lower than its operational value, and then stepped up one notch half an hour later, to protect the instrument from the high-gain effects. These low-gain switch-on are visible on both figure up to a point just beyond IJD=2000.
Gain aging Slowly however, the slow gain change due to ions migrating from the gold microstrips through the plate glass, started to become a much stronger effect, and as the mission progressed the low-HV switch-ons were no longer needed as gain began to start low and rose up to a higher stable level at the beginning of each revolution. This is an artifact of long-term gain aging of the plate, and the effect continued to increase during the remaining mission. However, the overall effect of gain aging by ion diffussion was to raise the stable gain level of the entire plate and it became necessary to reduce the High Voltage by one step every few months. The frequency of these HV reductions has decreased as the gain aging has slowly reached some kind of plateau value. The effect of these HV step-downs can be seen as a sawtooth shape on both units, with the distance between the peaks slowly increasing.
SPAG variations During the various gain-settling processes described above, the Spatial Gain changes, and changes differently, all over the plate thanks to small inhomogeneities in the glass, the microstrips and their spacing. These changes cannot be tracked for the entire plate and hence until the plate has warmed up and its surface charge and ion diffusion has stabilized the energy determination of the plate is somewhat uncertain, though rarely more than a few percent from ideal. Therefore it is always recommended that users avoid the first 5 to 10 science windows in a revolution for any application requiring excellent gain determination.
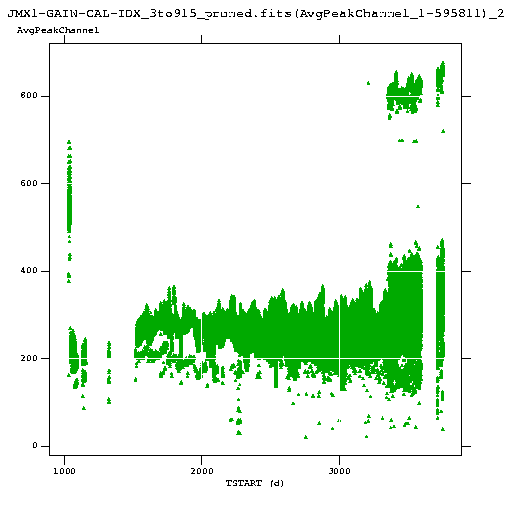
Other features Initially, a high HV value and a different energy binning table were used onboard which results in the very high channel values at the start of the mission. When it was discovered that the high HV value and proportionally large electron cascades were damaging the microstrip plates, a lower HV and different energy binning were adopted. As described above HV has subsequently been lowered at regular intervals to keep the instrument within workable gain limits.
Also, as the intensities of the calibration sources have decreased the scatter on the values has increased. The most extreme cases of scatter are where grey filtering has further diminished the calibration data and automatic gain determination has failed: in these cases channel values well below the real once appear as a fine scatter of points under the main curve, starting well before IJD=3000 for JEM-X1, but confined to the latest revolutions for JEM-X2. These are the handful of cases where offline correction are needed. Most recently spurious super-high values have also appeared, but these are ignored by the software.
In a few cases, during the Crab calibration observations, where both units were activated simultaneously, engineering experiments with lowering the HV value were performed and so the peak positions appear unusually low for these revolutions.
If you have any questions about the energy calibration of JEM-X science data please contact me at Carol Anne Oxborrow. I am happy to help all JEM-X users with the energy correction of their data using the OSA software, especially in cases where offline IC gain history tables need to be used.
* The files are cleaned of all their ISDC-admin data and empty rows
CAO 14/07/2010