Full Analysis for Revolution 332
 Our first thought was that the source 3 calibraton area had been contaminated
by hotspot events that had `drifted' up from the hotspot along the microstrip
anodes due to the hotspot activity confusing the position determination
algortithm. This kind of extended hotspot activity has been seen before.
N.B: All data used in the following analysis come from the 7 public science
windows that fall immediately before IJD=2010.00 i.e. all originate from the
troublesome time period.
Our first thought was that the source 3 calibraton area had been contaminated
by hotspot events that had `drifted' up from the hotspot along the microstrip
anodes due to the hotspot activity confusing the position determination
algortithm. This kind of extended hotspot activity has been seen before.
N.B: All data used in the following analysis come from the 7 public science
windows that fall immediately before IJD=2010.00 i.e. all originate from the
troublesome time period.
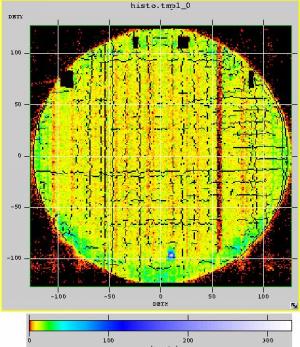
A shadowgram produced from
all the available public Science Windows clearly shows the hotspot at the
bottom of the detector. However there is no sign of extra events along the
attached anodes (running vertially in this image).
The red stripe to the right is an area of dead anodes which produces a
reduced number of events, and is generally ignored during processing of science
data. The rim of the detector is most strongly affected by instrumental noise
and it is here we see the most instrumental background due to Xe fluorescence
in the detector gas, and other lines due to fluorescence of instrument
materials. The four black areas at the top of the detector are the areas where
calibration spectra events are removed from the stream of science data and
put into the housekeeping telemetry. Sources and calibration areas are numbered
from left to right.
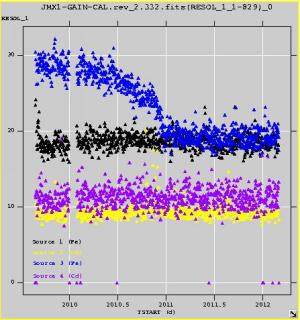
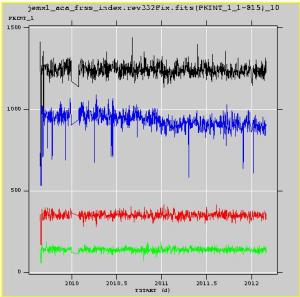 The analysis of the raw calibration spectra performed by
j_calib_gain_fitting suggests that during the anomolous period the calibration
spectra from the source 3 region were confused by the addition of another
spectral peak at a slightly lower frequency than that of the Fe calibration
source. This is borne out by the substantially increased width of the source 3
peak during this period (left), and the slightly increased number of events in
the fitted peak (right). In both figures source 3 is shown in blue.
The analysis of the raw calibration spectra performed by
j_calib_gain_fitting suggests that during the anomolous period the calibration
spectra from the source 3 region were confused by the addition of another
spectral peak at a slightly lower frequency than that of the Fe calibration
source. This is borne out by the substantially increased width of the source 3
peak during this period (left), and the slightly increased number of events in
the fitted peak (right). In both figures source 3 is shown in blue.
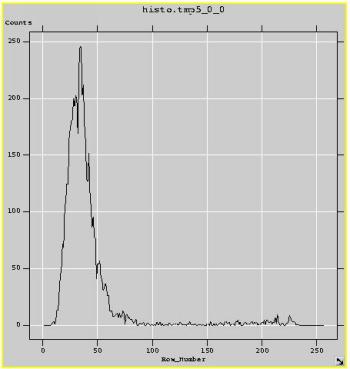
 Hotspot activity of some kind is a good candidate for this extra peak
because hotspot events have a very soft spectrum (left) peaking close to 6 keV.
The x-axis scale is given in PI bins, which is a logarithmic scale. Channel 83
corresponds to 6 keV.
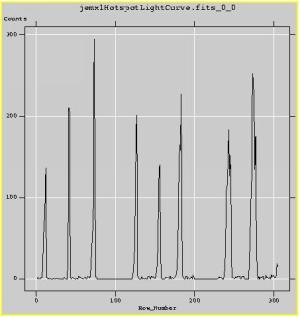
However, hotspot activity is very transient compared to the long and stable
effect we see on source 3 (right). Number of hotspot events against time in
minutes is shown. The data shown here comes from the hotspot seen in the
shadowgram above. However, we cannot rule out that a small hotspot has
developed in the calibration region itself but cannot be seen due to the lack
of spatial and time resolution in this area. If an unfortunate hotspot had
developped right under the calibration source, it would be expected to behave
like other hotspots and have a strong pulsation, though this cannot be
garanteed.
Hotspot activity of some kind is a good candidate for this extra peak
because hotspot events have a very soft spectrum (left) peaking close to 6 keV.
The x-axis scale is given in PI bins, which is a logarithmic scale. Channel 83
corresponds to 6 keV.
However, hotspot activity is very transient compared to the long and stable
effect we see on source 3 (right). Number of hotspot events against time in
minutes is shown. The data shown here comes from the hotspot seen in the
shadowgram above. However, we cannot rule out that a small hotspot has
developed in the calibration region itself but cannot be seen due to the lack
of spatial and time resolution in this area. If an unfortunate hotspot had
developped right under the calibration source, it would be expected to behave
like other hotspots and have a strong pulsation, though this cannot be
garanteed.
Evidently, a hotspot like that seen in the shadowgram could not cause our
problem. If we turn our attention to the problem of dead, dying or unstable
anodes, it is possible that lower energies might be seen all along such an
anode. We have already seen the effect of an unstable anode strip running
through a calibration area on JEM-X2. Unfortunately, the effect was so strong
that we could no longer use that particular calibration source (source 4)
because it was unreliable and produced gain values not reflecting the gain
of the plate as a whole.
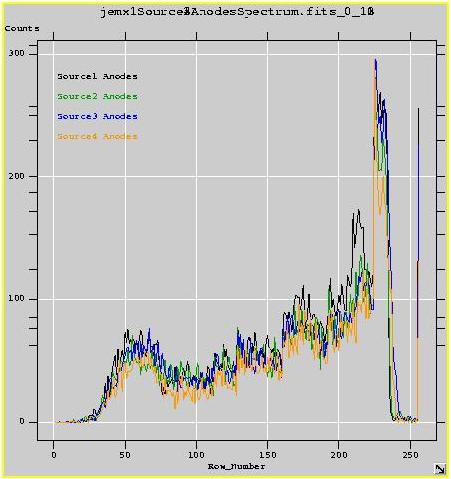 To test this possibility
we have taken spectra from the public data science windows using only areas
that have the same X-position values as the four calibration areas i.e.
spectra for the anodes running under these areas. The figure shows that there
is not a substantial difference in the spectra for these four different areas.
Again, source 3 appears in blue. There is certainly no evidence of a 20%
difference in the blue curve compared to the others. This would indicate that
there is no general problem associated with the anodes that run through the
source 3 calibration area.
To test this possibility
we have taken spectra from the public data science windows using only areas
that have the same X-position values as the four calibration areas i.e.
spectra for the anodes running under these areas. The figure shows that there
is not a substantial difference in the spectra for these four different areas.
Again, source 3 appears in blue. There is certainly no evidence of a 20%
difference in the blue curve compared to the others. This would indicate that
there is no general problem associated with the anodes that run through the
source 3 calibration area.
Currently, we have no idea what caused this drop in gain on source 3, but to
the best of our knowledge this behaviour is unique to this revolution. We shall
continue to monitor the instrument for other instances of this problem, but
it is not considered a serious problem for the instrument as a whole.
CAO 1/12/2005